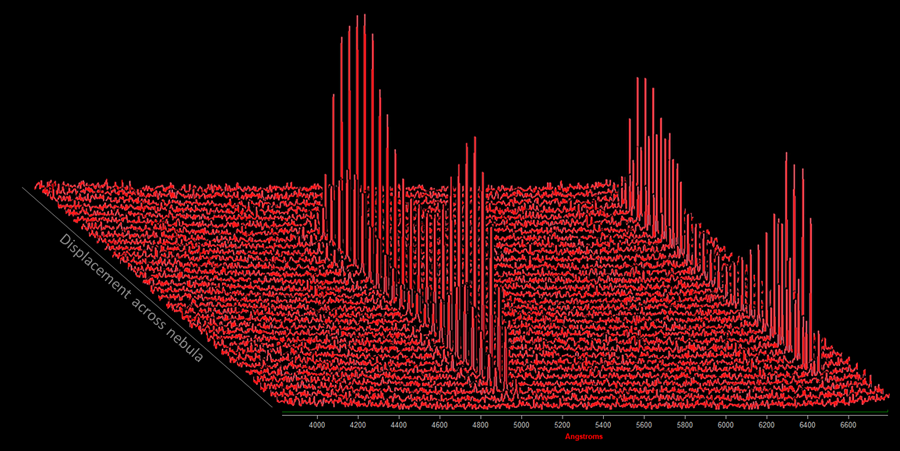
As the analysis window moves across the spectrum (left hand image) note that the nitrogen signals (either side of Hα on the right at 6563Å) are strong at the edges, (top and bottom of the scan) but disappear in the centre. This appears to show that the red colour seen in photographs at the outer edge of the nebula is mainly due to nitrogen, not hydrogen.
Below is a plot of each frame of the video, offset to show the changes in peak height.

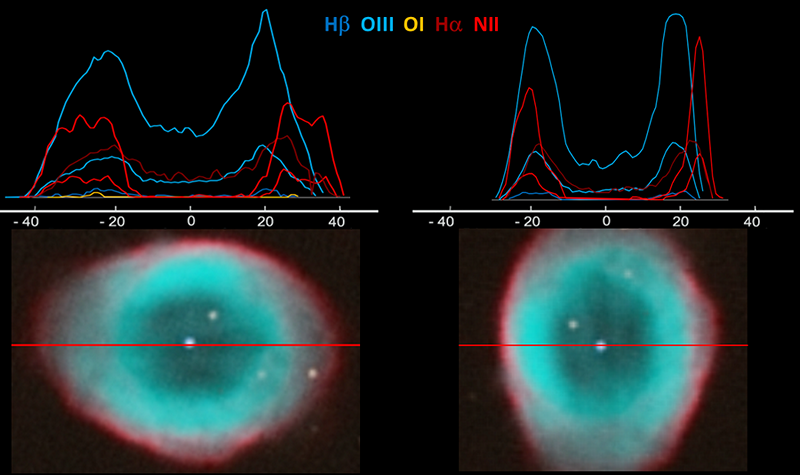
Plot of the peak intensities from the spectrum across the nebula. (x-scale is arcsec from centre)
