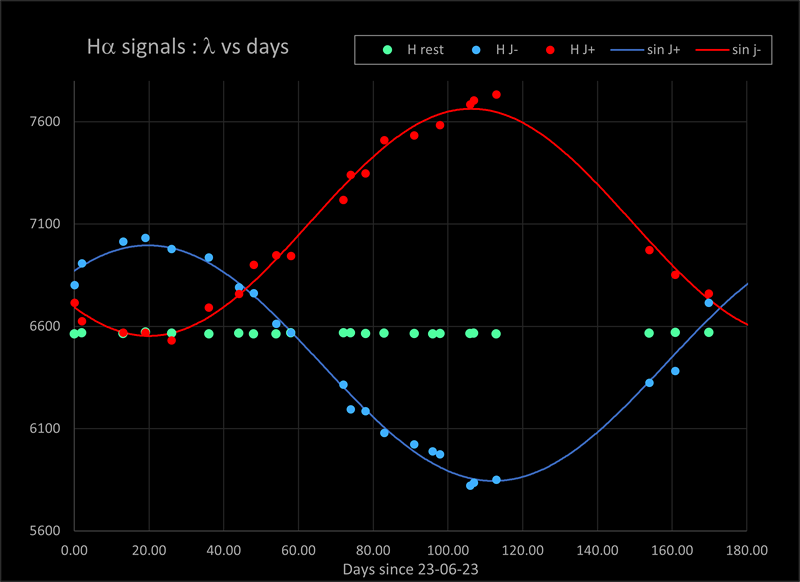
This is an ongoing project with observations continuing.Graph of position of Hα lines over time since June 2023 The red and blue Hα line positions change as the jets from the black hole precess. This is caused by the opposing jets pointing towards the Earth and then away during precession. Thus the H lines from the jets cycle from blue shifted to red shifted over the quoted prescession period of 162.4 days. The green plot shows the brightest line from hydrogen in the system but not in the jets. The gaps in the data was due to weather and seasonal observability.
The red and blue curves are the best fit sine curves to the data,
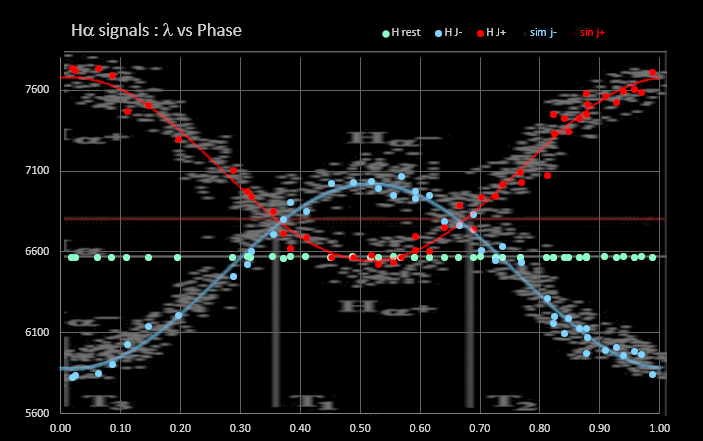
Below is a phase diagram of observations so far superimposed on published data from
Example spectra from 2023HAG 24" RC 'David Harris' telescope, Lhires III spectroscope 300gr/mm, ZWO ASI2600MM Pro camera.Analysis with RSpec software. 
|